
Well we lost the sunshine on Thursday but it was still breezy and it didn't feel any milder.
The Met Office have now published the Central England Temperature figure for February 2015. By the end of the year this is the go to figure that tells us just how warm the year has been in comparison with previous years.

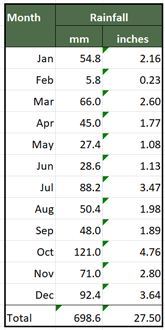
I've included last year’s completed table on the left for comparison purposes. Both months this year have been much closer to the long term average than they were last year when the first four months of the year were exceptionally mild. February had the highest anomaly* of any month last year but that isn't the case this year.
The monthly Central England Temperature data published by the Met Office can be found here.
*
I think I understand how the anomaly figure is worked out. Records from the CET between 1961 and 1990 are averaged out for each month and Jan 2014 is compared against the average value for the Januarys between 1961 and 1990 records. The difference between these two values is the anomaly. The result is that January 2014 was 1.9°C warmer than the long term average.

Our first camellia flower of spring looking a bit battered and bruised by the wind.


0 comments:
Post a Comment
Thank you for visiting my blog and leaving a comment - it is great to know that there are people out there actually reading what I write! Come back soon.
(By the way any comments just to promote a commercial site, or any comments not directly linked to the theme of my blog, will be deleted as soon as I spot them) Please do not follow links from any comments that appear to be spam - if in doubt ignore.