
I blogged enough towards the end of September about how it had rained most days in the month. By the end of the month we'd finished up with 28 days when some amount of rainfall had fallen.
 |
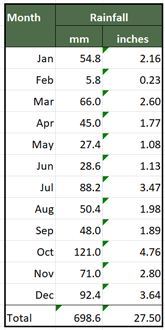
| Annual Rainfall Data for 2017 to Date |
I've highlighted September's figures which indicate the 28 days with rainfall and also show that we had 35.1mm (1.38in)more rainfall than average in the month with 76.8mm (3.02in) of rainfall. That makes it our second wettest September in my records with 2012 holding onto the record with 79.2mm or 3.12in. We're still heading for a lower than average rainfall for the year though as that "departure from normal column" indicates. However, we're about 42.7mm (1.68in) below average at the end of September as that total of -88.4mm (-3.48in) needs adjusting to allow for October's rainfall.

I've been through my weather station records to determine if we'd had any more months with so many days of rainfall. As it turns out we have.
 |
| Rain Days with 0.2mm or more of Rainfall 2010 - September 2017 |
The shading in the table goes from red least number of wet days in a month to blue indicating the wettest days in a month. The only other month with 28 wet rain days was January 2014 but as there's 31 days in January and only 30 days in September I think it's fair to say this September takes the record.
In the middle of September we had some windy weather which was strong enough to blow over our runner beans.
 |
| Runner Beans 22 September 2017 |
They fell over in a very tidy fashion but I'm guessing that to fall over in such a way most of the supporting canes will have been broken at soil level.
September was the third month in a row with below average temperatures. After a promising start to the year with above average temperatures in May and June tempting us to think some good summer weather was on the way July, August and now September have all been below average.

Maybe an Indian summer is on the way?


Great post Martyn. And great graphics. It looks like the Dep From Norm calculation is set to a full month so this will change dramatically once October is out. Your graphic shows how exceptional September had been but also that we are heading into the "rainy season" which usually lasts at least until January. As for wind your runner beans suffered from the direction of the wind setting up a domino effect. Yes I bet they did all snap off at ground level! Rotated by 90 degrees and they would have held on - but then wind direction is tricky to forecast. My 360 degree wigwam is still up and I have bitten the bullet on my Jerusalem artichokes chopping the down to size. Hope you are riding the storm as well as possible under the circumstances.
ReplyDeleteI had another chart that I didn't include as I thought it was going a bit over the top. Rather than rain days each month it shows rainfall amounts. Strangely there isn't that obvious winter wet season shown by looking at the number of wet days. In summer it must be less rain days but the ones we do have have heavier more substantial rain.
Delete