Remember to click on the image to view charts in full size
Temperature and Rainfall Details for the last 4 weeks
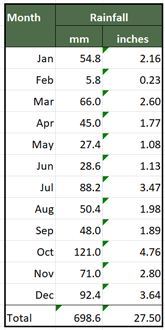
The charts below to compare our monthly temperatures this year with those of last year and the coldest and warmest temperatures for each month. The figures are mean temperatures for each day. Scroll through the individual monthly sheets for daily temperatures and rainfall figures.
Temperature and Rainfall Details for the last 4 weeks
The charts now include temperatures recorded by my weather station for the same period 12 months ago
 |
| From 2011 Weather Charts |
 |
| From 2011 Weather Charts |
Table produced using data from the Met Office Hadley Centre. The data covers the period 1772 to 2009
Greenhouse v Outside Temperatures
I've added this data and chart to the January 2011 tab on the above spreadsheet. Rainfall details are also included on this tab too.
Greenhouse v Outside Temperatures
I've added this data and chart to the January 2011 tab on the above spreadsheet. Rainfall details are also included on this tab too.


I like the page with your weather/temp info. What equipment/software you using to record. Is it manual or do you have a device of some kind? I want to upgrade my barometer :)
ReplyDeleteCheers, Craig.
Hi Craig
ReplyDeleteGlad you like my weather page. To be honest I'm still trying to sort out the best method. I am using a Davis Vantage Pro 2 weather station. So it records all the weather on a data logger and I then use their weatherlink software to down load results onto my PC via a USB cable. Their software does some nice tables of data but i've used Microsoft Excel for the graphs and Google spreadsheets for some data. I used a Nexus weather station but wanted to get data almost live onto the web so I upgraded to a Davis weather station. Intended to put details of set up on the web site as allotmenting slows down.
By the way thanks for sending the wet weather our way. More rain today so July is now our wettest month of the year.
Cheers, Martyn